
We spent President's Day weekend with friends of Andy's from Grad School.
While eating delicious waffles on Sunday morning one of the families brought out a book by NASA called Earth as Art. We knew our friend Lawrence worked at NASA, but it turns out he actually led the effort to create this book.
I must say - it's amazing.
You can get a PDF of it for free, or download the free iPad App. Unfortunately the print version of the book isn't available to the public yet.
A few days after I saw the book, NPR did a profile as well:
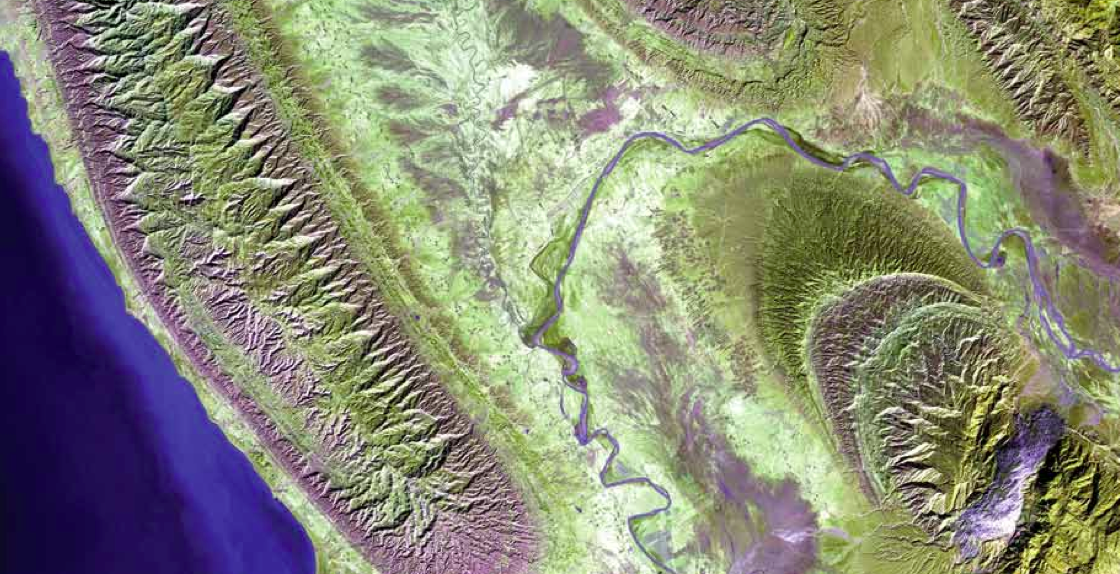
Some of the instruments aboard the satellites collect data in different ranges of wavelengths of light. These "spectral bands" break up all the visible and invisible light into chunks: the reds, the blues, the greens and even infrared, a wavelength of light that humans can't see.
When researchers piece the image data back together, they can be selective about which "bands" of light are displayed in the final image. "The selection depends on the intent of the analysis," Friedl wrote in an email. "An analysis of vegetation would probably select the red, green and infrared bands — vegetation is 'bright' in those bands and the analyst could differentiate between the types or health of vegetation."
Friedl says analysts generally don't go out of their way to make images look surreal, but this kind of spectral analysis can be used to great effect. "There are whole books written on what band combinations to use to bring out certain features," he told me. Like rocks: When studying the retreat of the glaciers of the Himalayas, Friedl says, you can train software to recognize the light signature of exposed rock. And instead of directly measuring the glaciers themselves, you can see where new rock is getting exposed year over year.[1]
Take a minute and enjoy the Beauty of the Earth.
[1] Earth As Art: 'How Did Nature Do That?' by Andrew Prince. February 20th, 2013